← All projects
Bubble Crime
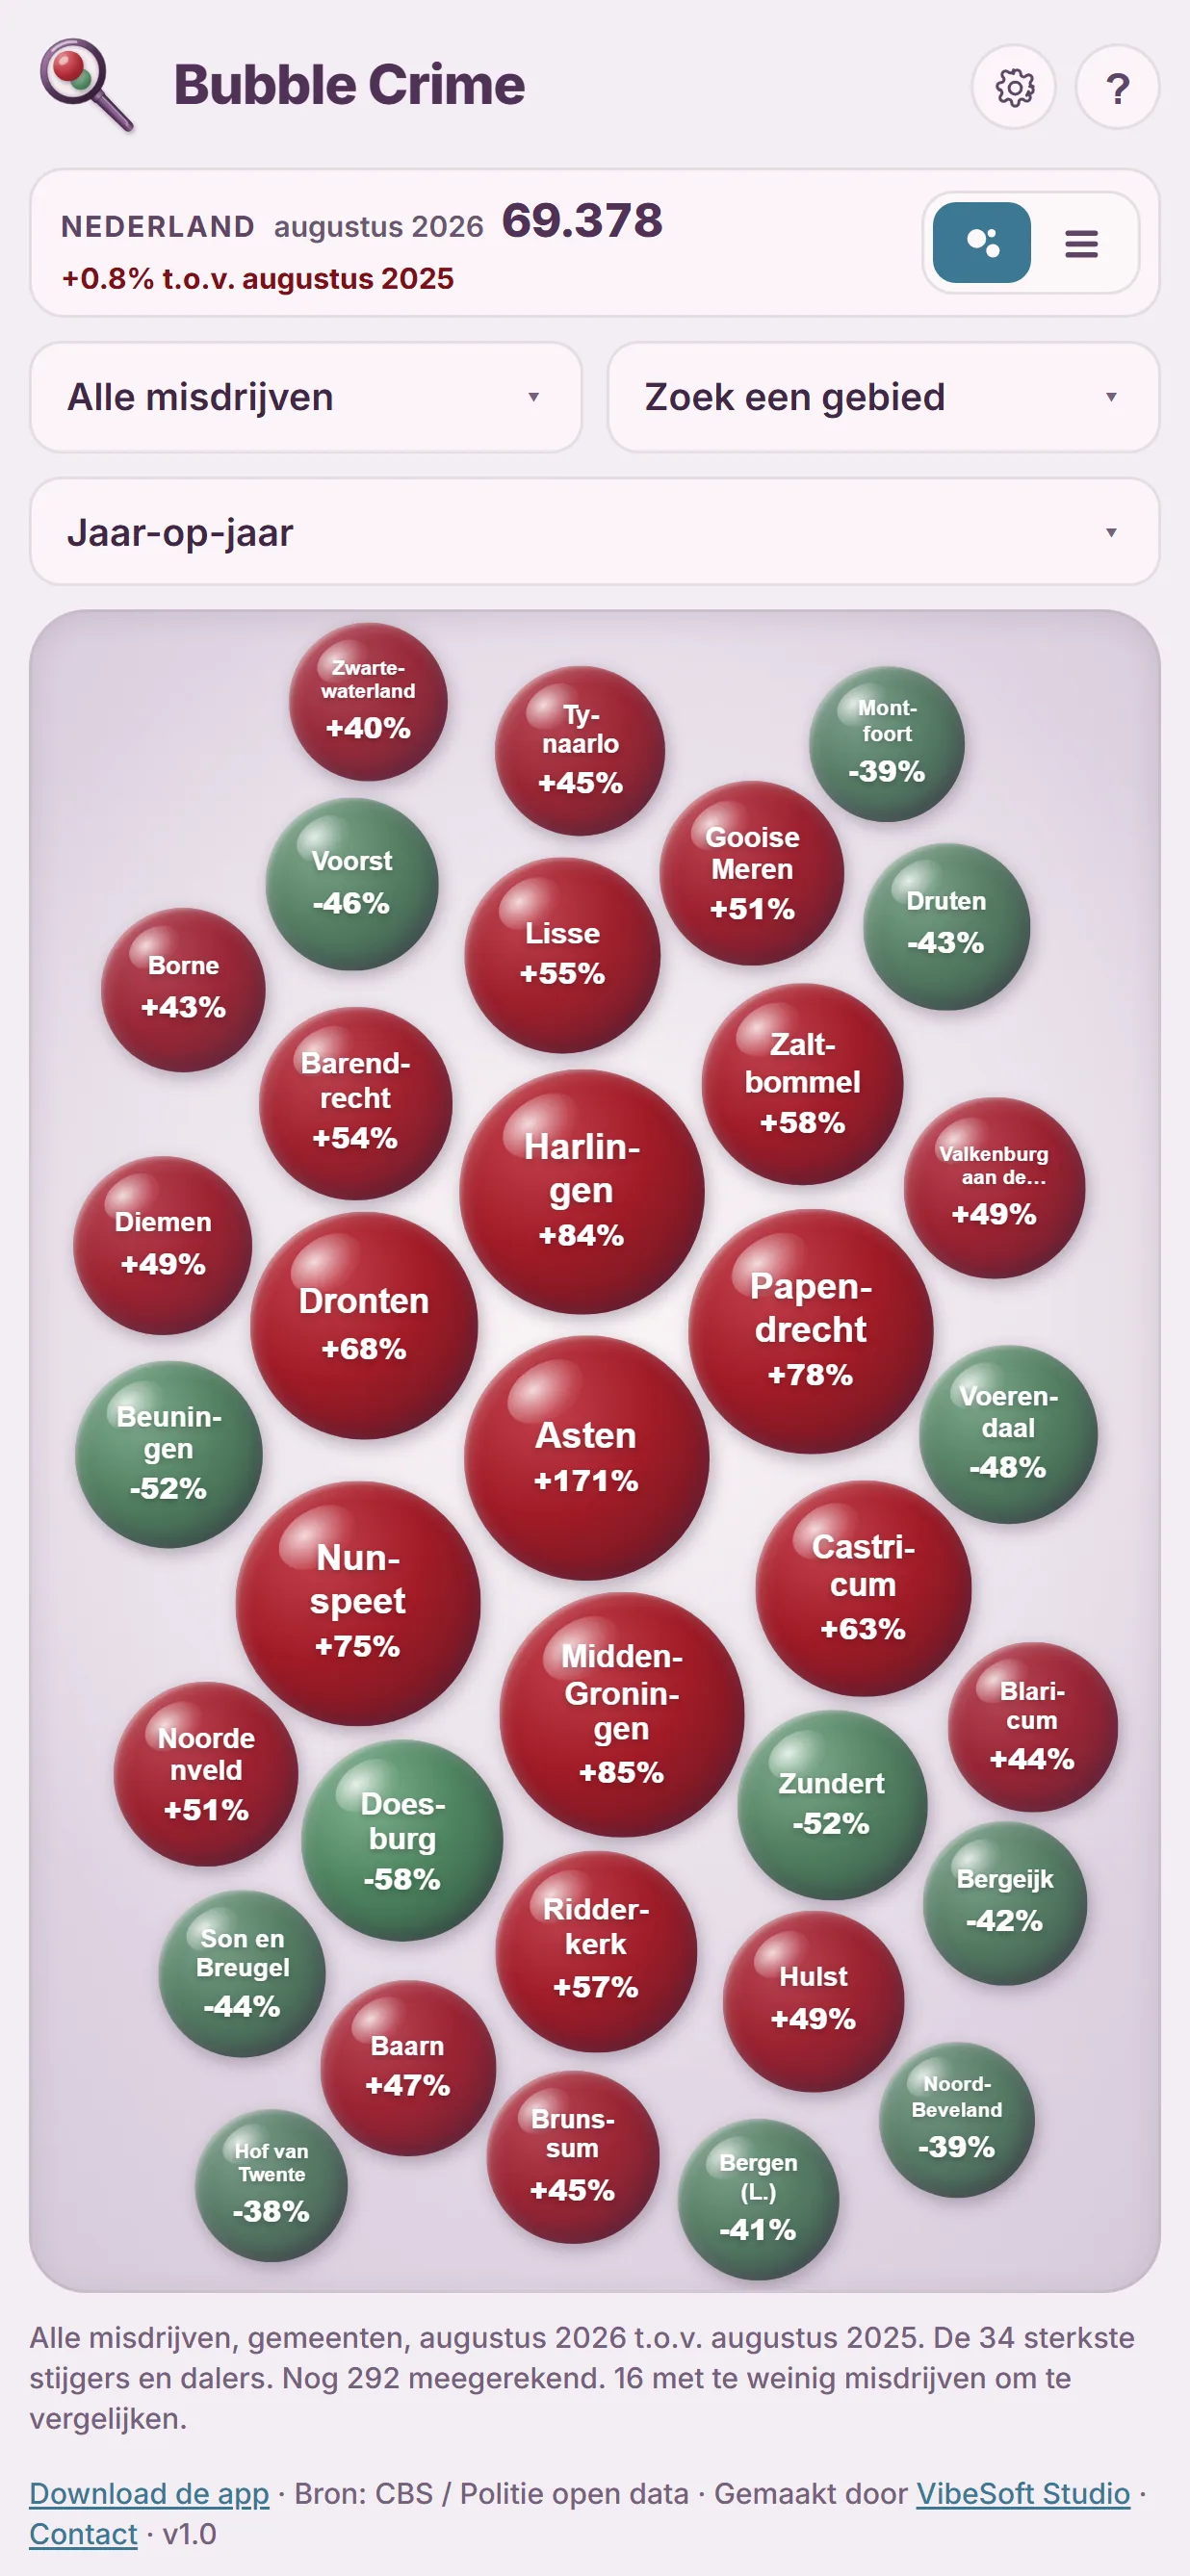
Registered crime in the Netherlands as a bubble map, per municipality, district and neighbourhood.
- Released
- October 10, 2026
- Available on
- Android and Web
- Category
- Open data NL
Screenshots
What Bubble Crime is for
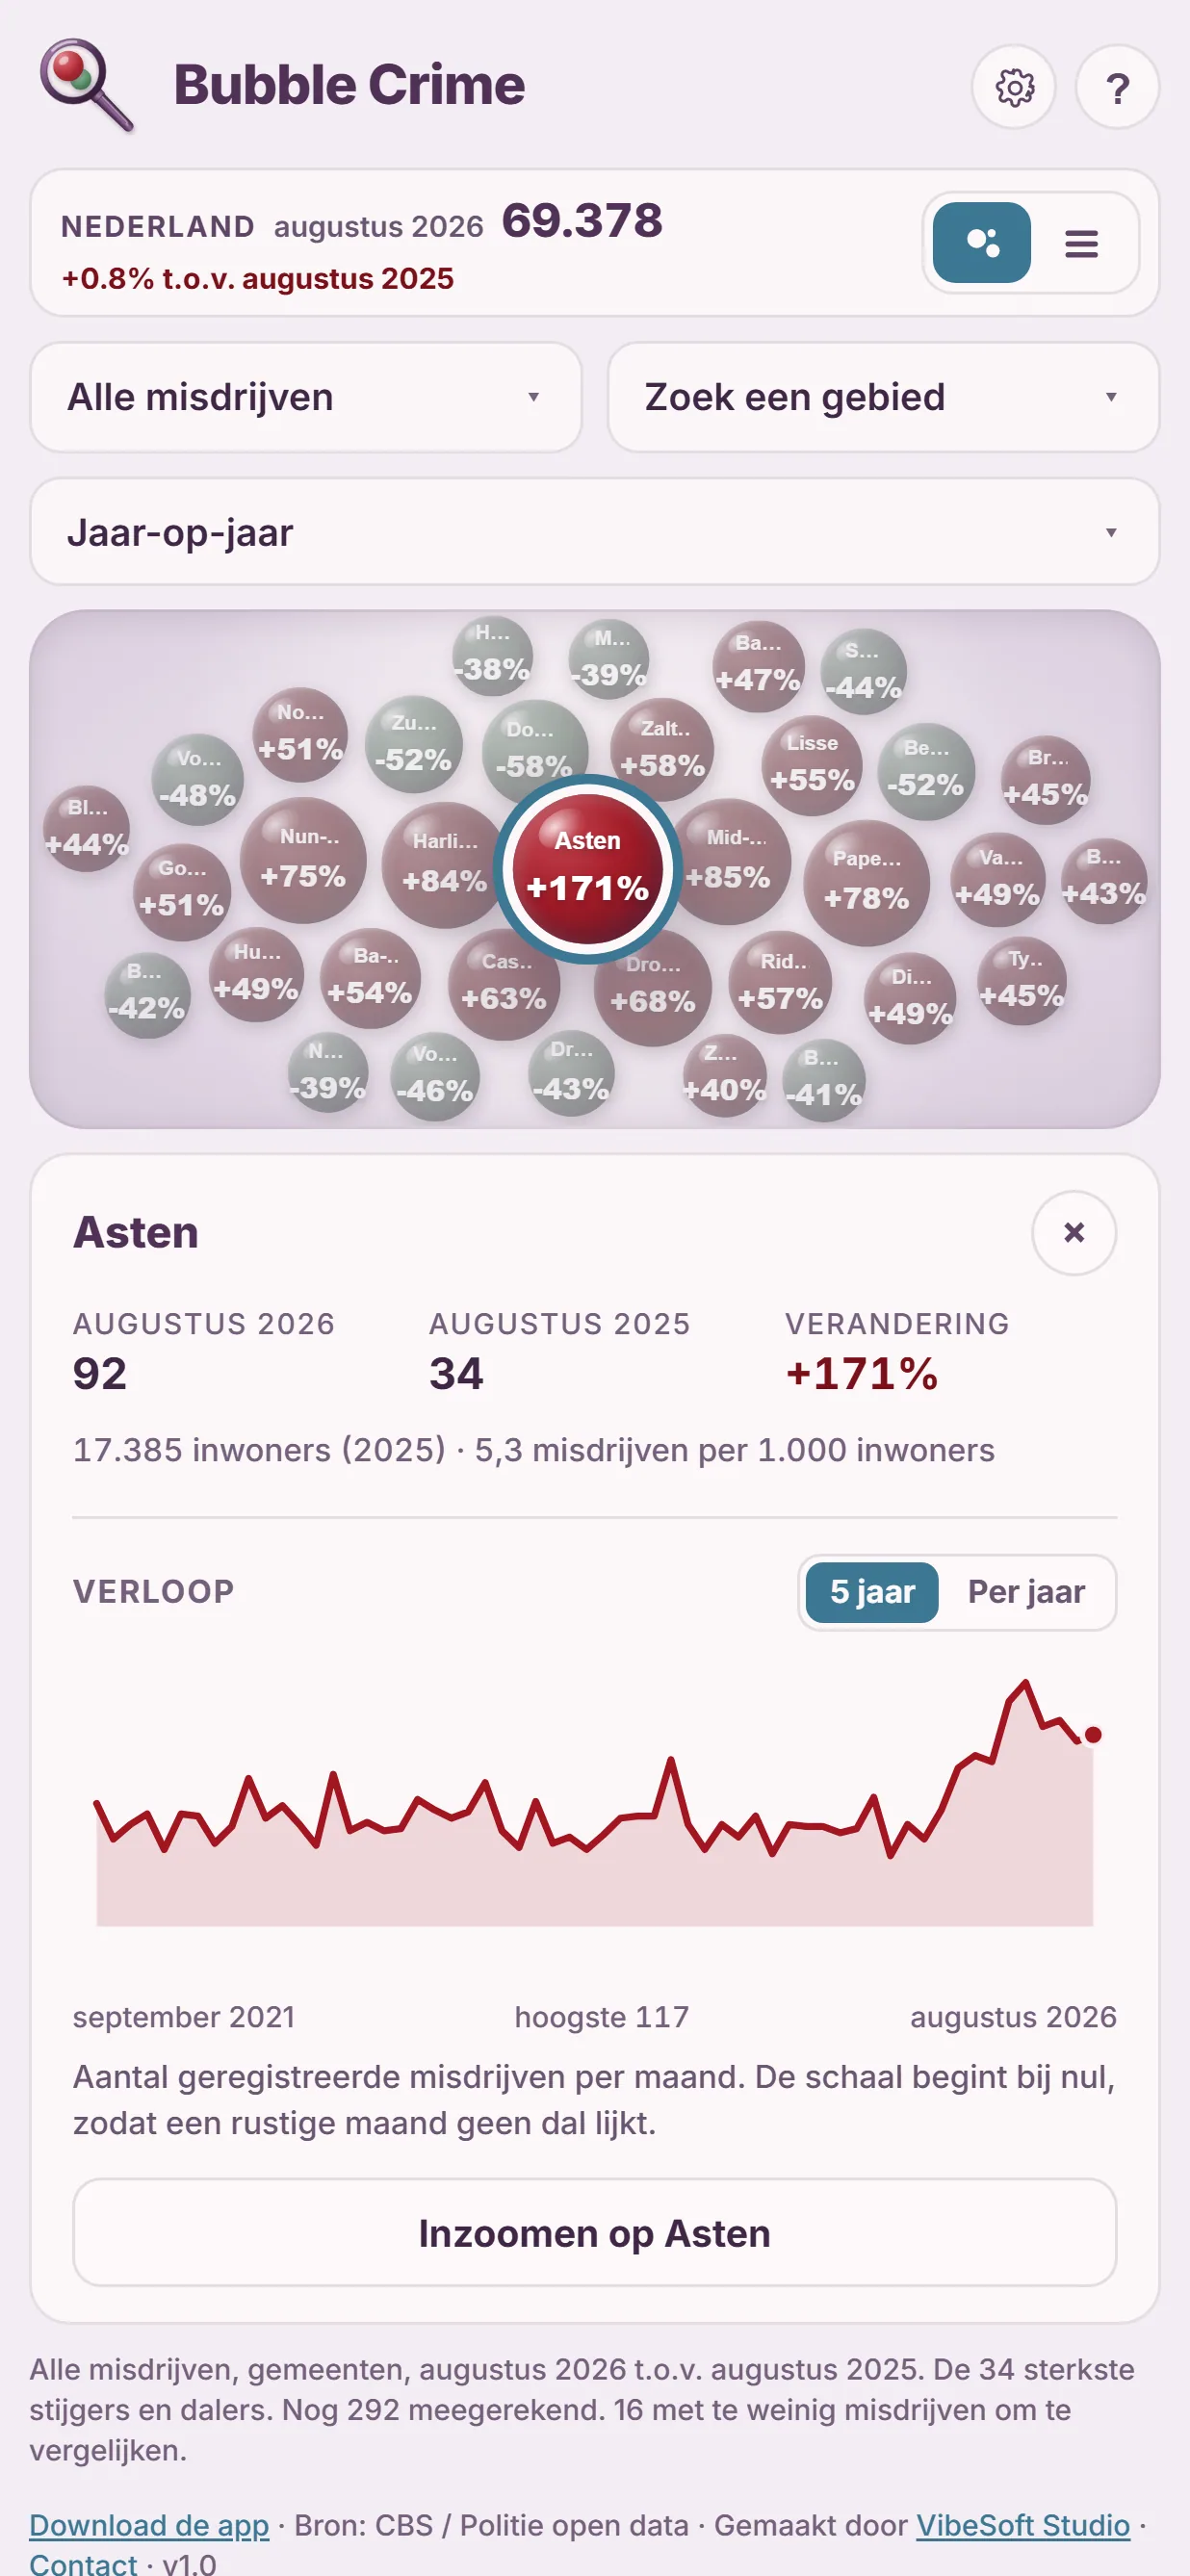
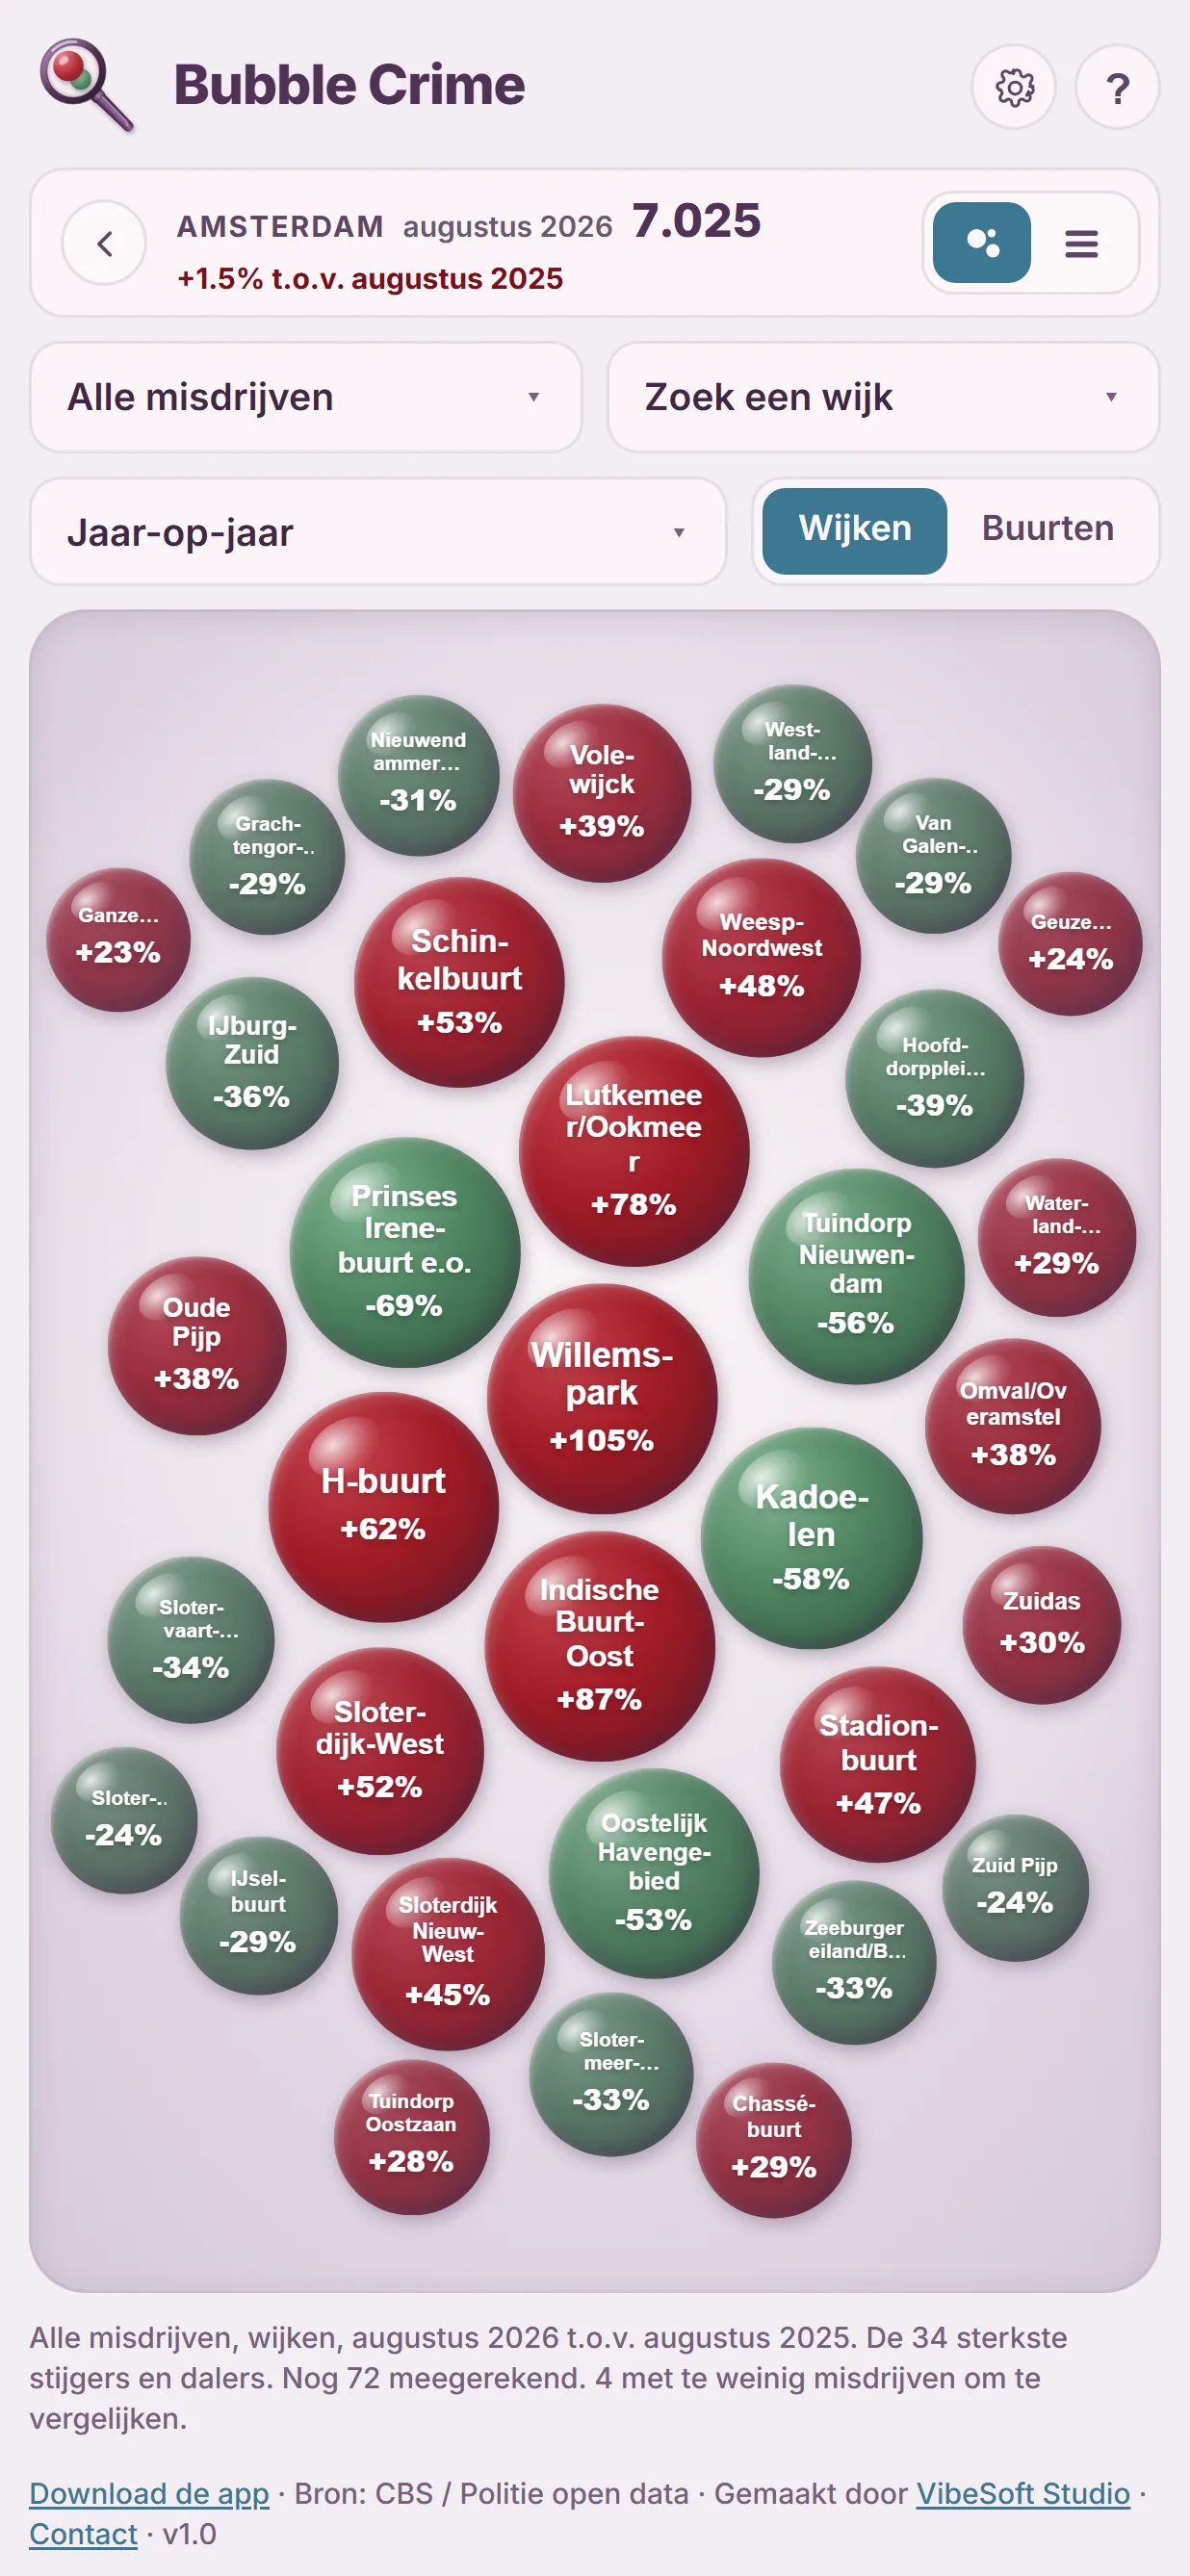
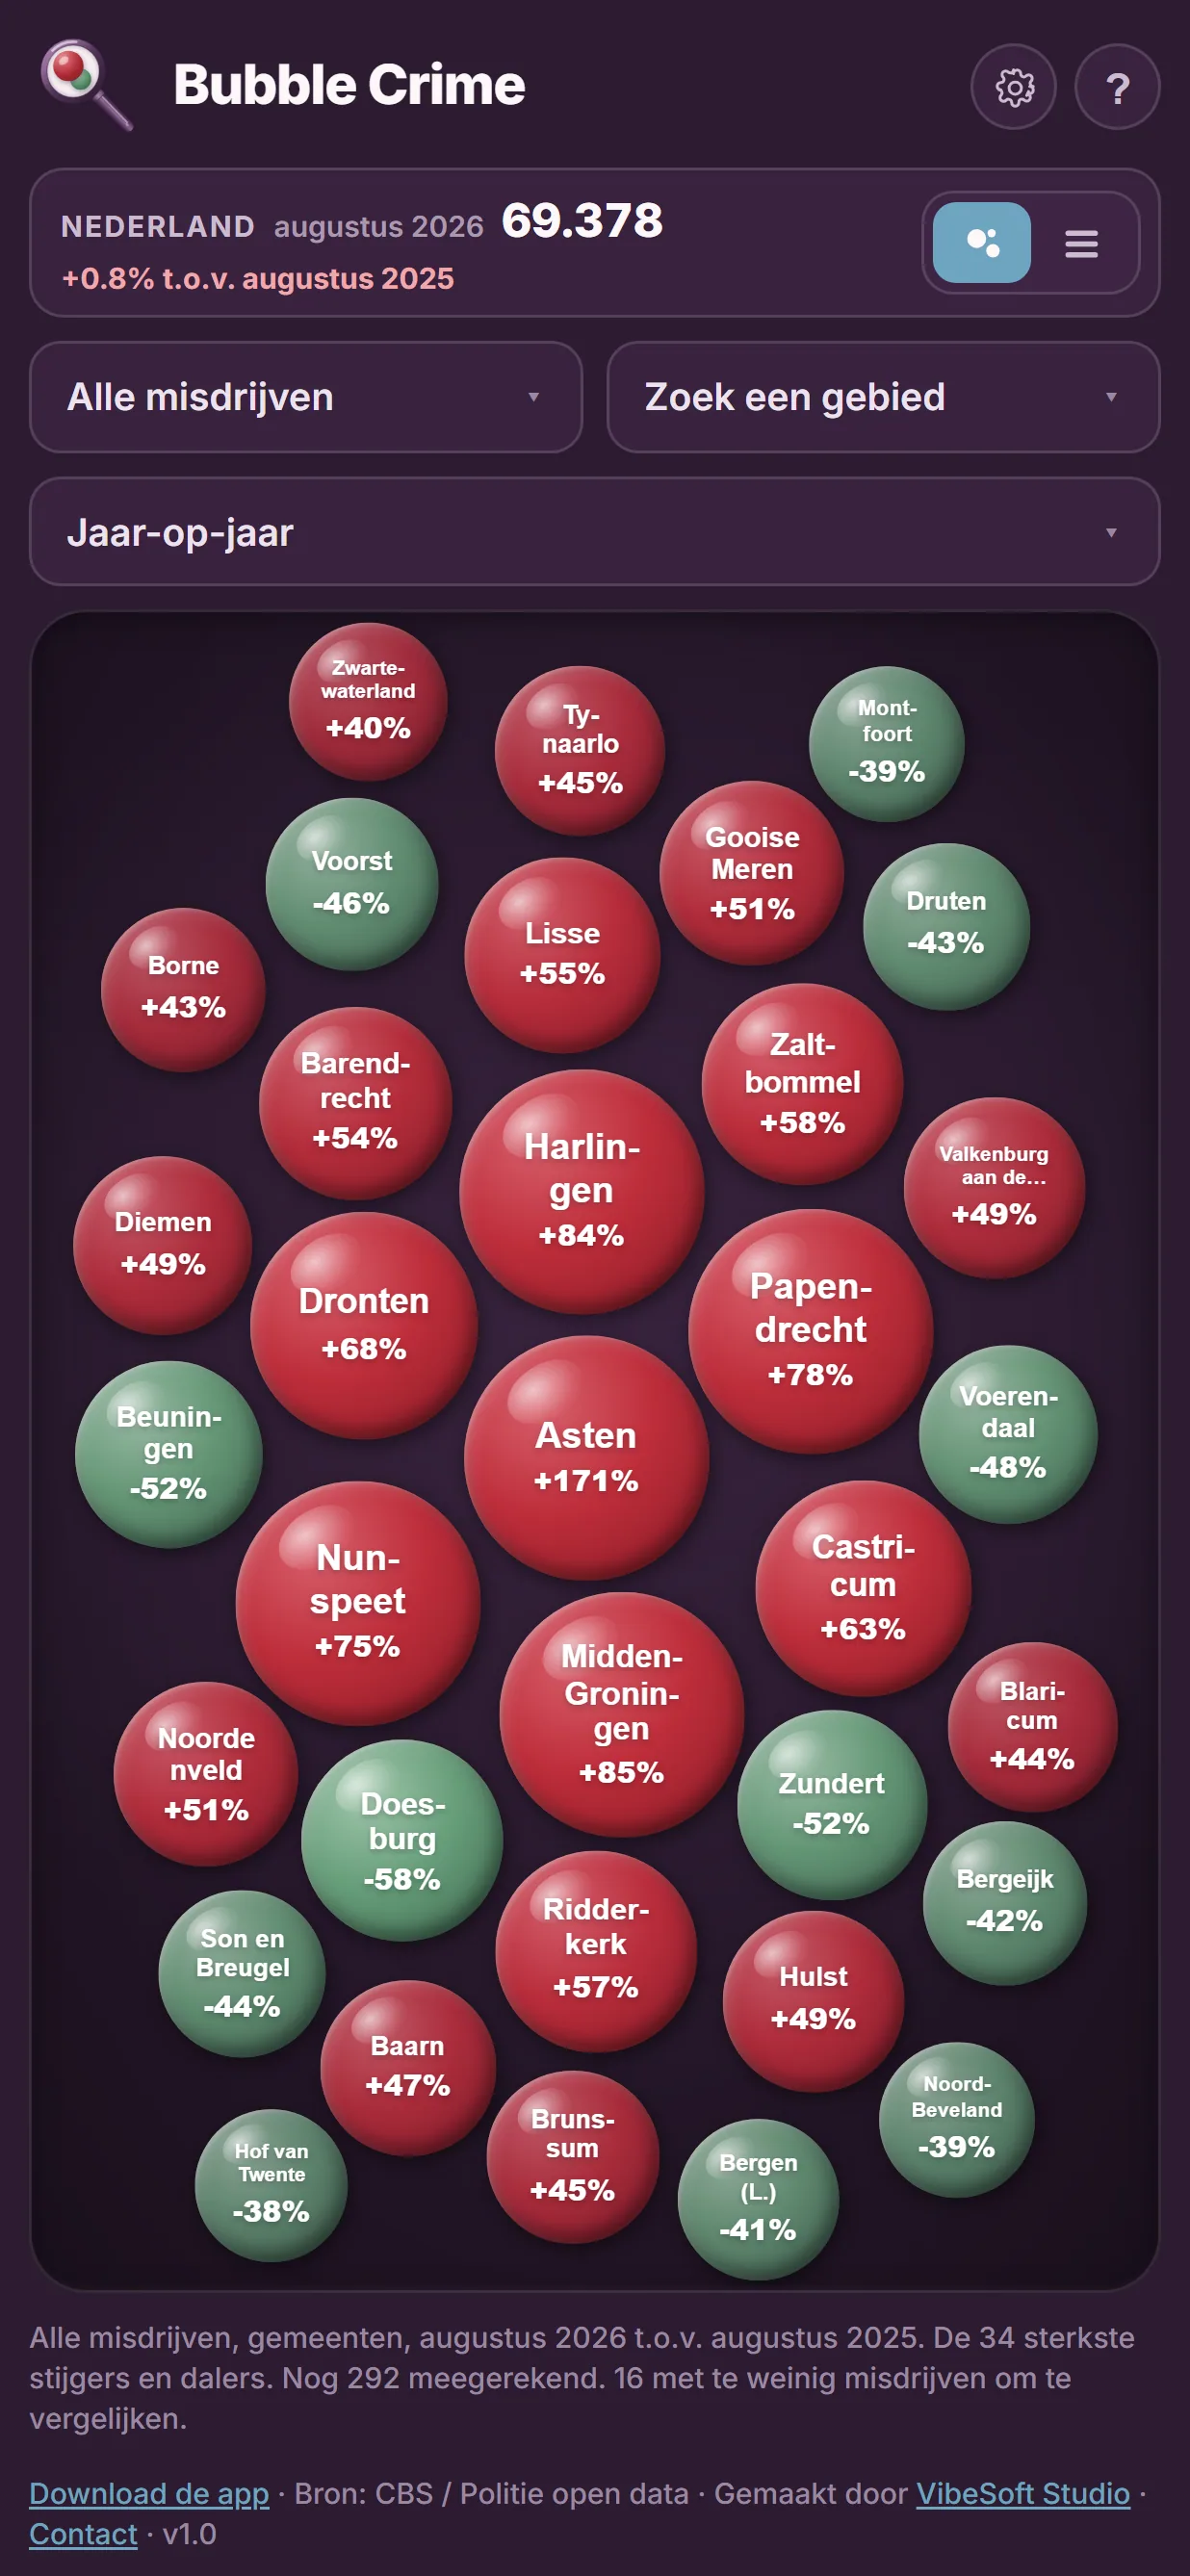
Bubble Crime puts the police's registered crime figures, published as open data by CBS, on a board full of bubbles. Every municipality is a bubble: the bigger it is, the more changed there, red is rising and green is falling. Tap a municipality and the board rebuilds from its districts; tap a district and you get the neighbourhoods. From the whole country to the street around the corner in two taps.
Dutch only, by design: the interface, the data and the Play listing are all in Dutch. No account, no profile. Free with a banner; a one-time purchase removes the ads.
Bubble Crime shows figures, not a verdict on how safe a neighbourhood is.
Use cases
- Looking up your own area: Go from the whole country to a neighbourhood in two taps, or jump to your own municipality.
- Comparing periods: Compare year on year, month on month or whole years, by percentage change, by count or per 1,000 inhabitants.
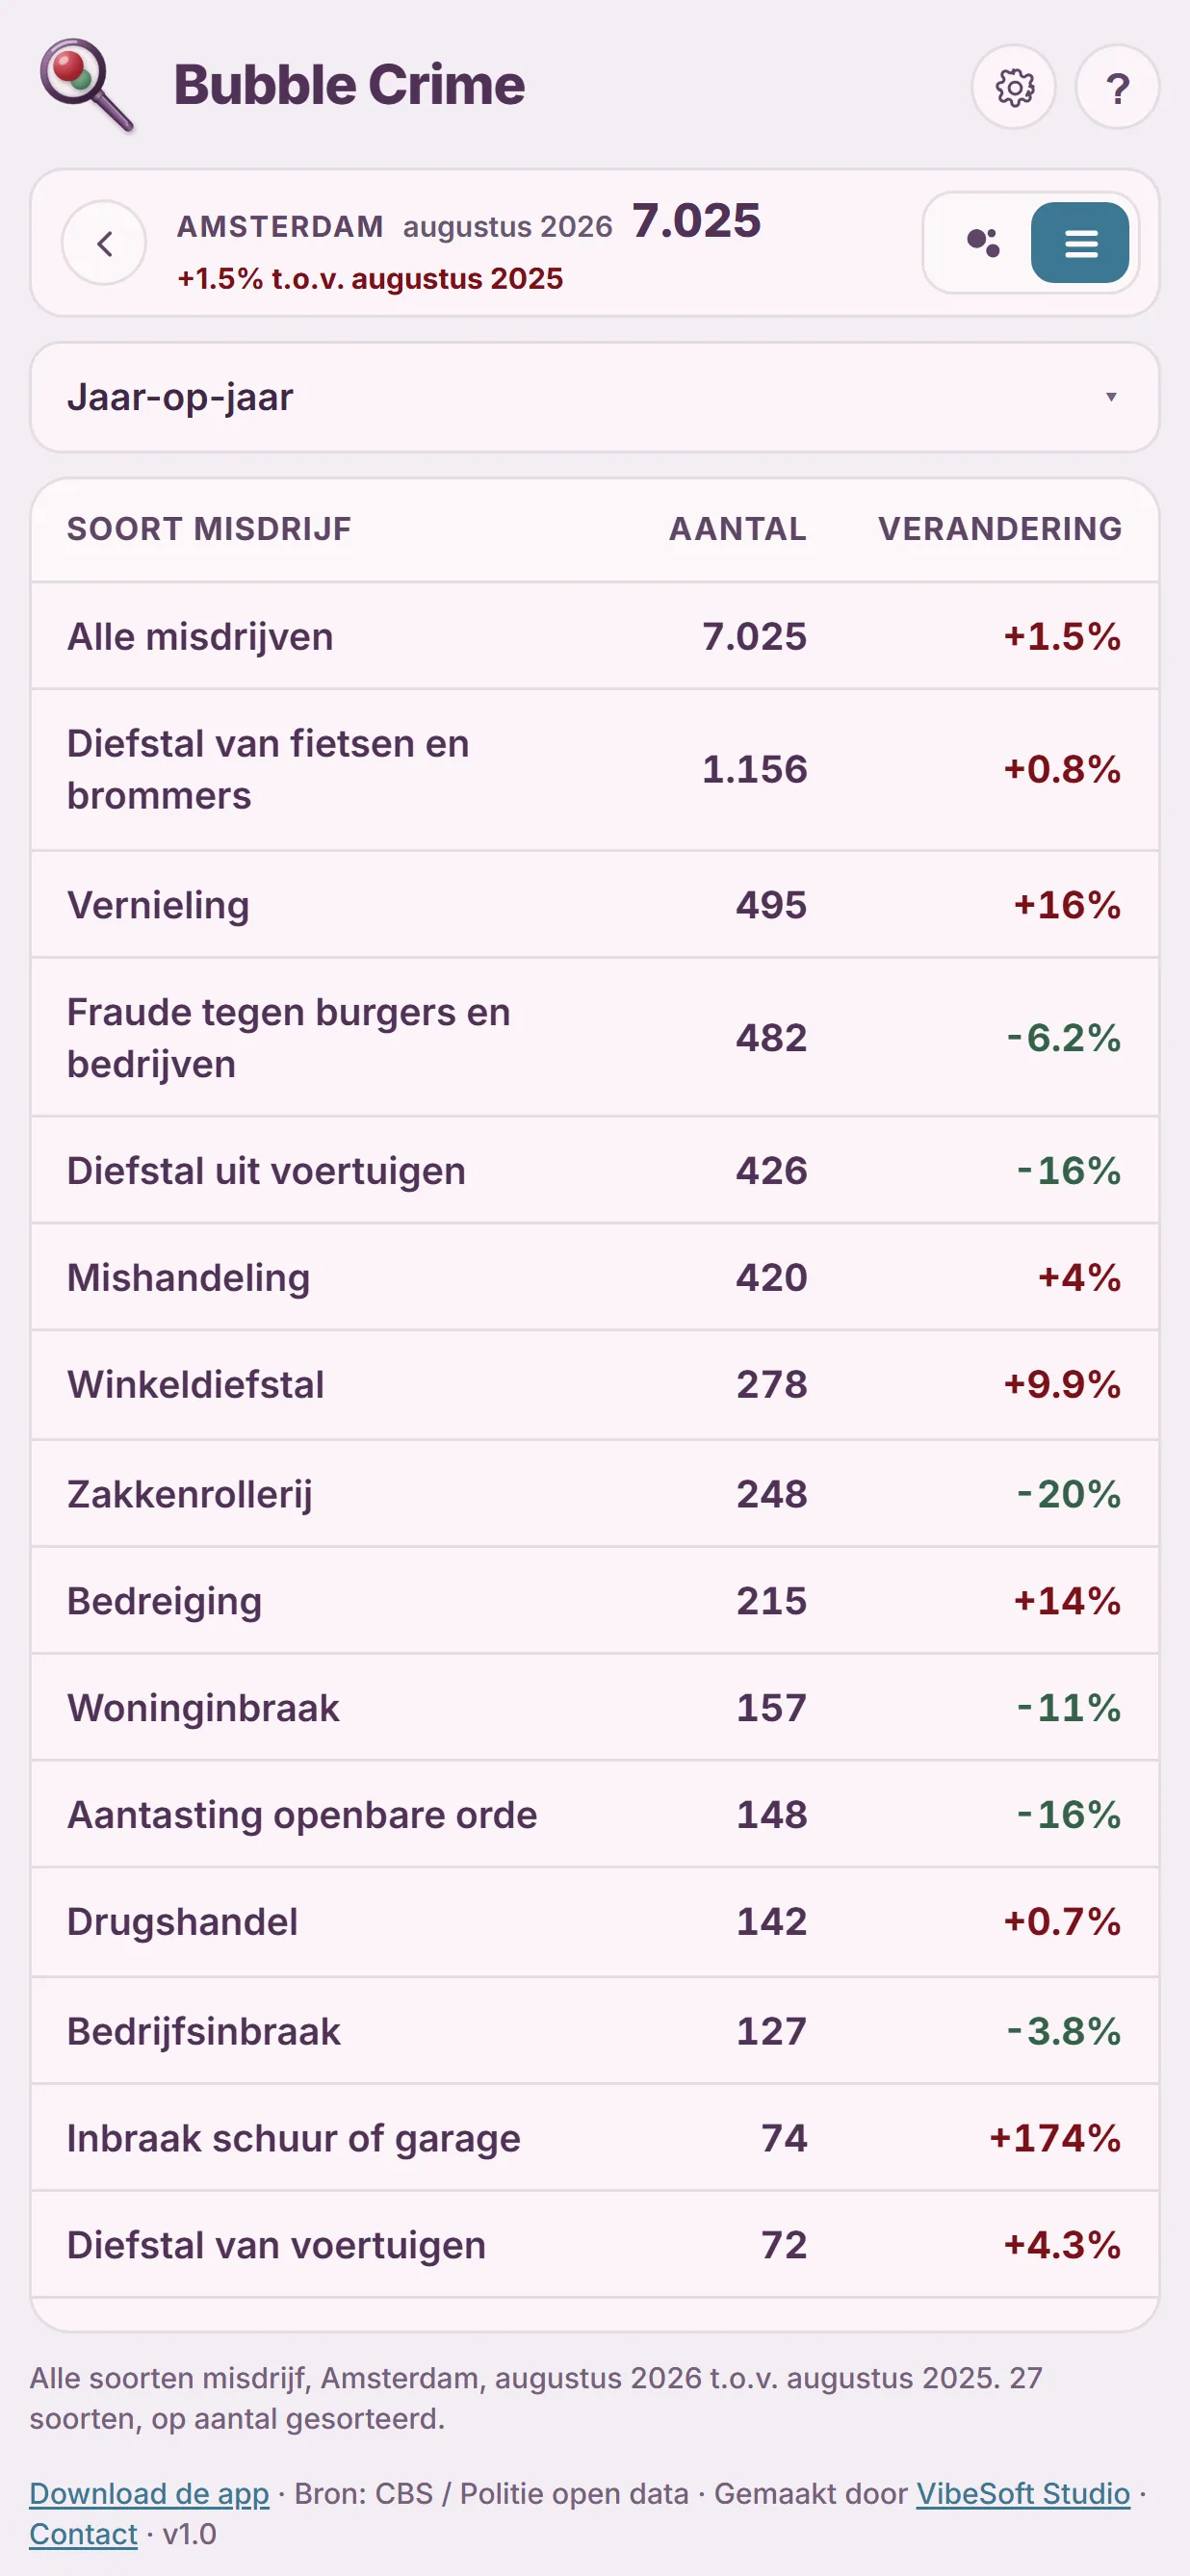
- Checking one kind of crime: Thirty types, from burglary to bicycle theft, or all of them together.
What it does
- Thirty types of crime, from burglary to bicycle theft, or all of them together
- Compare year on year, month on month, or whole years
- Bubble size by percentage change, by count, or per 1,000 inhabitants
- Mijn locatie jumps to your own municipality; approximate location only, nothing stored
- Honest about the numbers: registered crime is what was reported, and areas with too few cases stay off the board
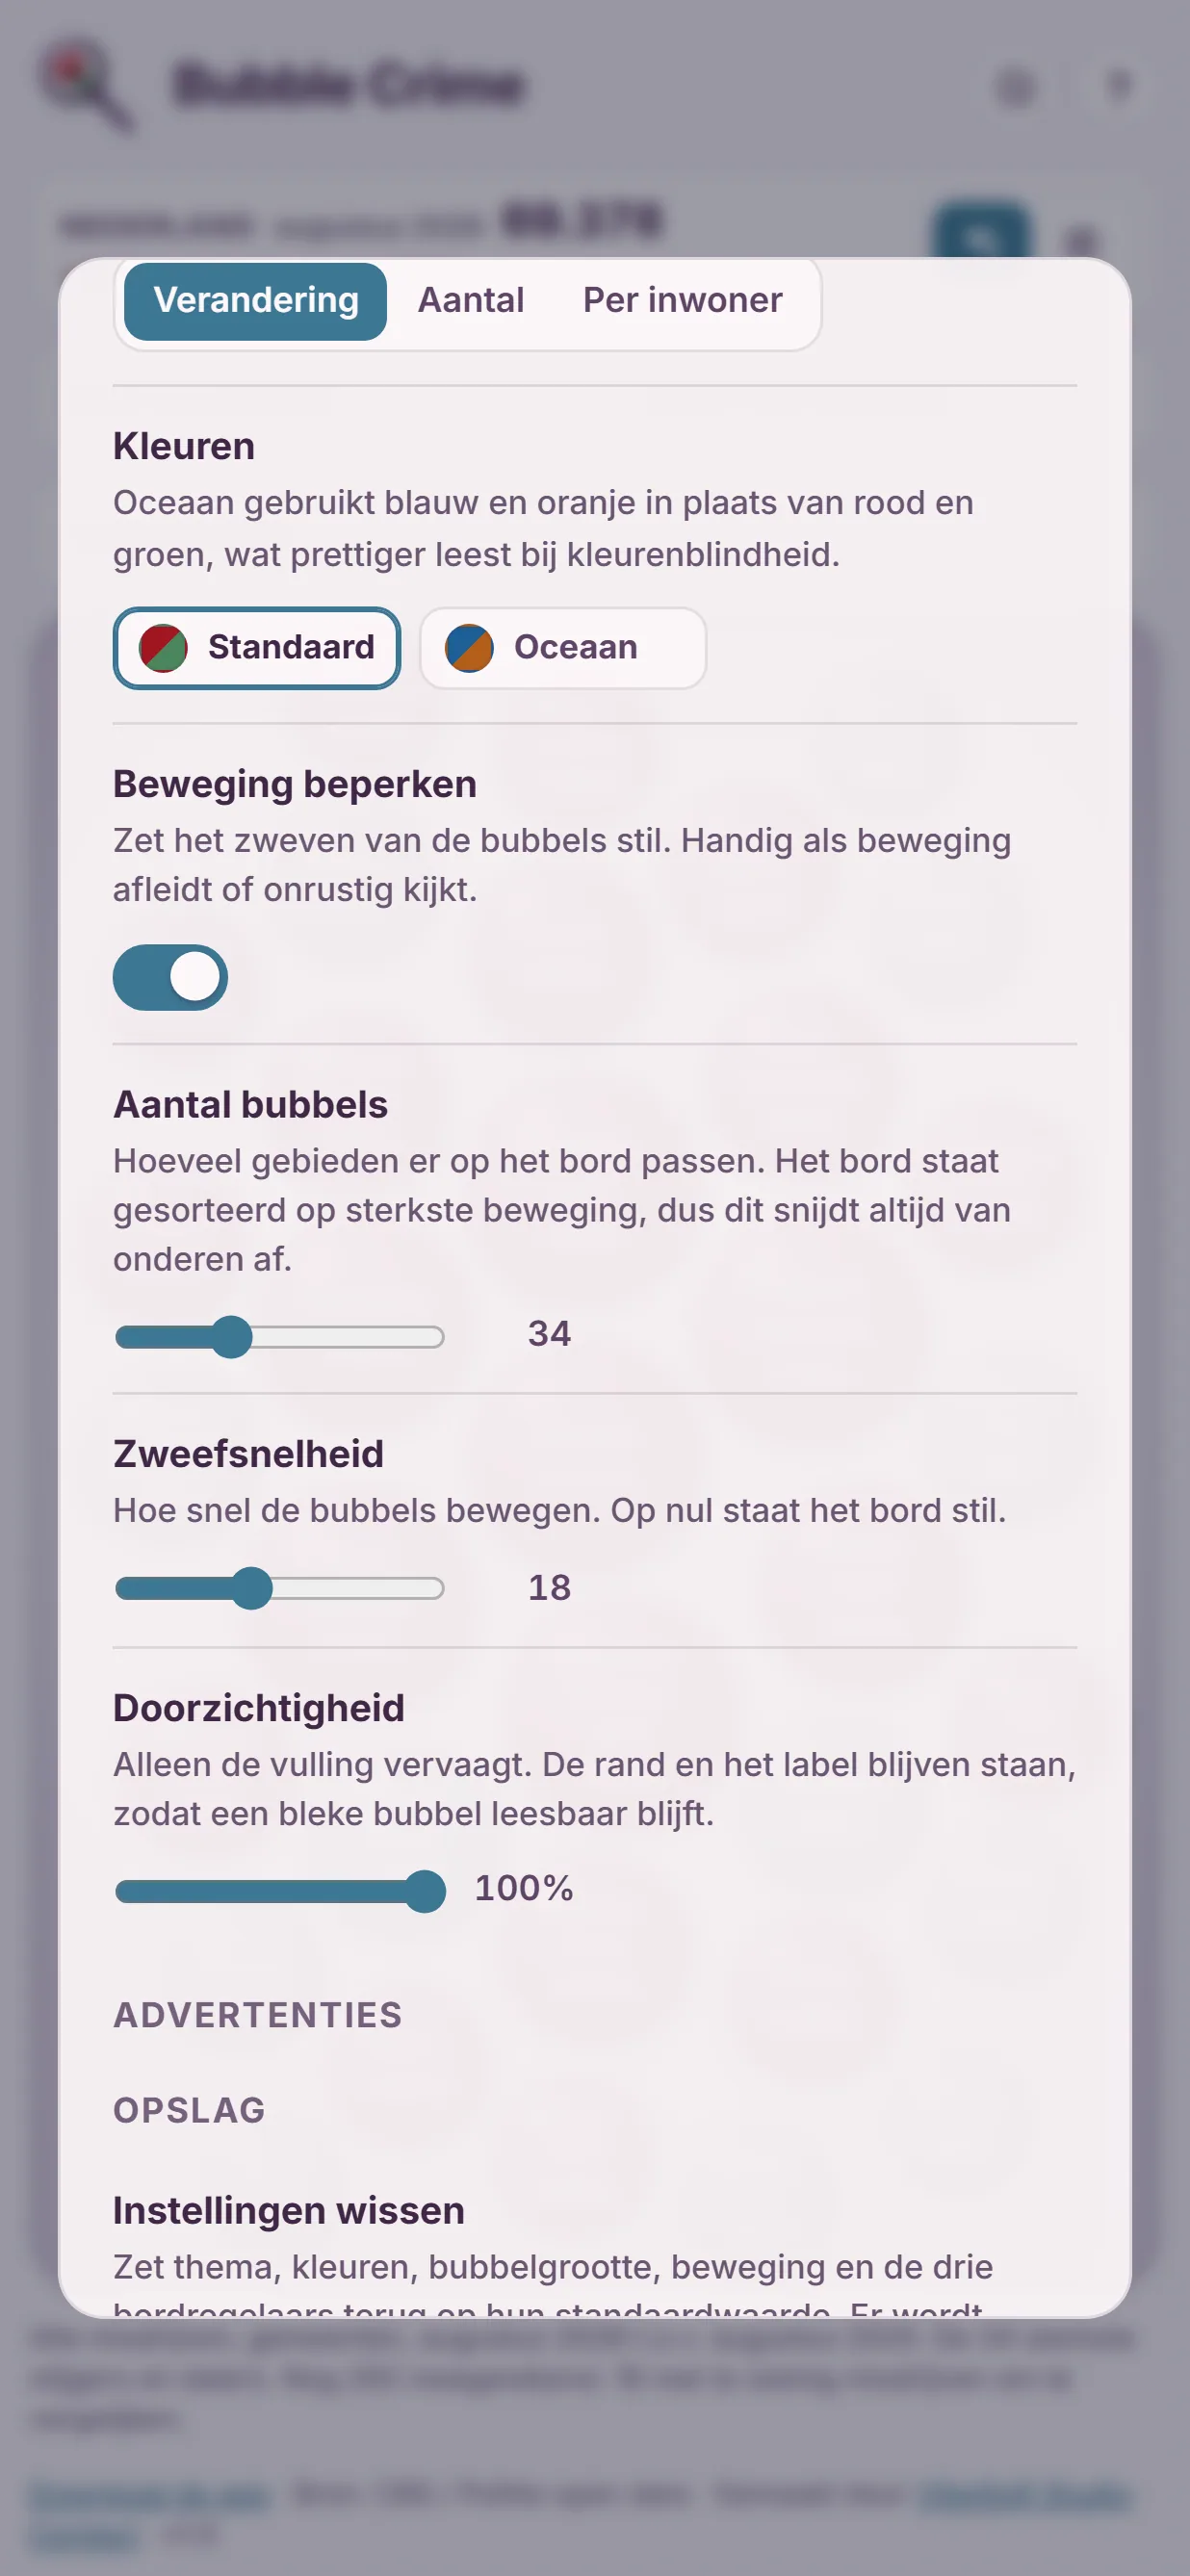
- Light and dark theme, a colour-blind palette, motion that can be switched off
- Source: CBS open data (tables 47013NED and 47022NED), updated monthly